18 September 2014
Mining for Data Gold: What We Learned From Our Blog Content Audit
As the marketing co-op at Gaslight, I’ve been able to jump right in and do real work from the start. I’ve spent the past two weeks conducting a content audit of this blog, researching, analyzing and reporting the information back to the team.
It took me a little time to get the hang of Google Analytics and to manually enter some of the data—everything from traffic to social shares and number of comments—in a spreadsheet that was easy to digest and share. I learned a ton about the company by doing this audit, and I wanted to share some high points of my research (illustrated with cool charts and graphs by designer Tammy Gambrel!):
10 Most Popular Posts
Traffic Jam

This was the average number of page views for our top 25 posts. Our top 10 posts racked up an average of 13, 296 page views and more than five minutes of engagement.
Top Bloggers

Two Gaslighters racked up a huge proportion of our top viewed posts. Way to go Joel and Chris!
Hot Topics

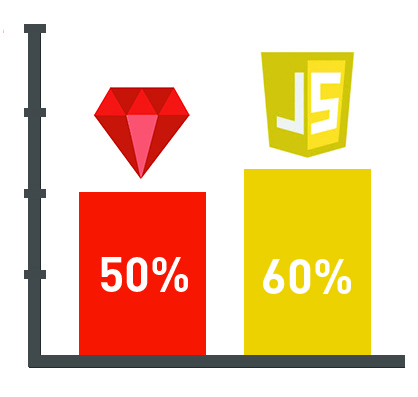
We have a pretty big readership in the development community, and it showed up in our numbers. A whopping 60 percent of our most popular posts were tagged JavaScript and 50 percent were tagged with Ruby.
Engaging Reads

If you look at our top 10 posts by time on page, four were tagged JavaScript, four were tagged Ruby, two were tagged iOS development and two were tagged CoffeeScript. The average time on page for these good reads was 6 minutes and 38 seconds.
What People Like

Ninety percent of our top-performing posts had comments, external links and visual aids. These features gave people plenty of ways to learn more about the topic and join right into the conversation.
This was just a small piece of the content audit, but we’re pleased that our traffic and engagement numbers keep growing while our bounce rates go down. Anything you’d like to see us write about on the blog? And changes you’d like to see?


